|
|
|
ORMS Forecast Analysis
Note: This topic applies to ORMS ADF11.
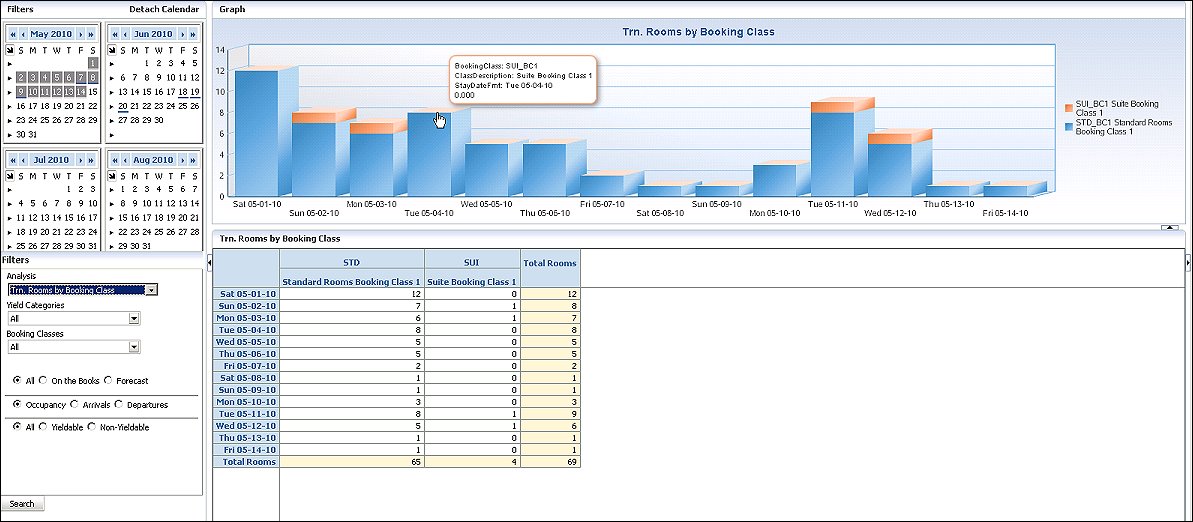
The Forecast Analysis Dashboard displays past, current, and forecasted room and reservation data. This is a comprehensive and dynamic screen, helping you better view and understand your property's business. The summarized data can be divided and dissected (sliced and diced) allowing you to see the information from different perspectives. The Forecast Analysis information presents on-the-books and forecasted data in graphs and grids, providing filters for your specified views. All data can be viewed by Yield Category and Booking Class. You can also view the data segmented by groupings of market codes, source codes, channel codes and rate categories, depending on the graph selected. The groupings of market codes, source codes, channel codes and rate categories presented here were defined in Configuration Forecast Groups.
The Forecast Analysis Dashboard contains filters on the left-side of the screen with the Calendar and options for the type of data you want displayed. The data in the graph reflects the options you selected for analysis. Beneath the graph is a grid depicting the statistics that calculate the graph.
Revenue Management>ORMS FORECAST ANALYSIS - Access ORMS Forecast Analysis. This permission grants the user access to the Forecast Analysis Dashboard. All functions on the Forecast Analysis screen will be available to the user with this permission (view, search). If this permission is not granted, the Forecast Analysis screen is disabled and grayed out.
Select the options you want for analysis and select the Search button to display the results.
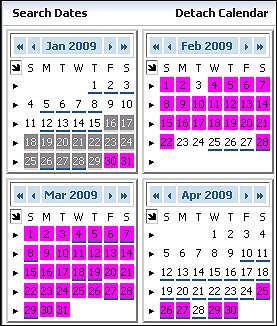
The calendar displays four months where you can select which dates you want for data to appear in the graphs and grids. When the dashboard first opens, the first month in the calendar grid is the current month, with the next three subsequent months displayed thereafter. You may select one date, multiple dates, or a date range for the displayed data.
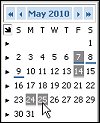
Depending on the active dashboard, various dates are already highlighted as configured:
Alerts - If the date is colored, there is a minimum of one alert for this date. Move the mouse over the date to display the pop-up hint describing the alert(s) for the date. The alerts and colors are user definable from Configuration>Alerts and Rules.
If you want to display a different set of four months, click on the (back) << < or (forward) > >> arrows at the top of the selected calendar month. The double arrow moves the calendar back two or forward two months, respectively. The single arrow moves the calendar back or forward one month, respectively. All other calendar months in the grid appear in sequence.
![]()
Individual Days - To select one day, simply click the one day. For several individual days not in a sequence (i.e. Monday Wednesday, and Friday) use Ctrl and click the separate days.
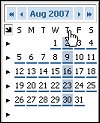
Same Days of the Week for the Month - To select a specific day of the week for the entire month, for example all Thursdays, simply place the cursor at the top of the day of the week (i.e. T) and click. You can also use Ctrl and select more than one day of the week for the entire month, for example, all Saturdays and Sundays.
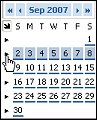
Entire Week - To select the entire week, click the pointer for the appropriate week.
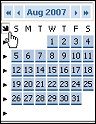
Entire Month - To select the entire month, click the arrow at the top of the month.
You can also expand the four-month calendar to a full 12-month calendar by selecting the Detach Calendar option. The detached, expanded calendar grid displays 12 months from which you can select dates. By default, the first month in the calendar grid is the current month, with the next 11 subsequent months.
Analysis. The Analysis LOV lets you select the type of data you want represented in the graph and grid. The graphs for analysis include the following:
Allotment Class. Displays when the Rooms by Allotment Class analysis is selected. Select the allotment class you want included for analysis from the LOV.
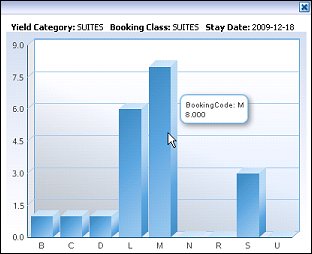
Booking Class. Displays when the Trn. (Transient) Rooms by Booking Class analysis is selected. Select the booking class you want included for analysis from the LOV.
Market Codes. Displays when the Trn. (Transient) Rooms by Market Code Group analysis is selected. Select the market code you want included for analysis from the LOV.
Source Codes. Displays when the Trn. (Transient) Rooms by Source Code Group analysis is selected. Select the source code you want included for analysis from the LOV.
Channel Codes. Displays when the Trn. (Transient) Rooms by Channel Code Group analysis is selected. Select the channel code you want included for analysis from the LOV.
Rate Categories. Displays when the Trn. (Transient) Rooms by Rate Category Group analysis is selected. Select the rate category you want included for analysis from the LOV.
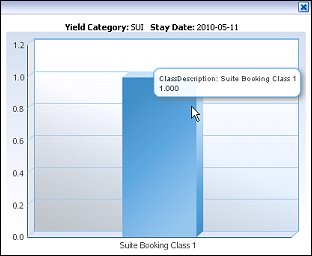
Yield Categories. Displays when the Total Rooms by Yield Category or Trn. (Transient) Rooms by Yield Category analysis is selected. Select the yield category you want included for analysis from the LOV.
LOS. Displays when the Arrivals or Departure radio button is selected and the Trn. (Transient) Rooms by Yield Category or Trn. (Transient) Rooms by Booking class is selected. Select the length-of-stay you want included for analysis from the LOV (All, 1,2,3,or 4).
Select the number of rooms affected by the type of analysis, for the date. The rooms are viewed by selecting the radio button of:
All (both On the Books and Forecasted) number of rooms affected by the type of analysis and date.
On The Books only number of rooms affected by the type of analysis and date.
Forecasted only number of rooms affected by the type of analysis and date.
Occupancy. Displays the number of Occupied transient rooms, based on the selection of All, On The Books, or Forecasted display option.
Arrivals. Displays the number of Arrival transient rooms, based on the selection of All, On The Books, or Forecasted display option.
Departures. Displays the number of Departure transient rooms, based on the selection of All, On The Books, or Forecasted display option.
All. Displays both yieldable and non-yieldable transient rooms by type of analysis selected.
Yieldable. Displays all yieldable transient rooms by type of analysis selected, based on the selection of All, On The Books, or Forecasted display option.
Non-Yieldable. Displays all yieldable transient rooms by type of analysis selected, based on the selection of All, On The Books, or Forecasted display option.
Certain graphs provide drill-down capabilities where you can view specific details by clicking on areas in the main graph. Graphs that provide drill-down functionality have tooltips identifying them.
 e Rooms by Allotment Class graph, when users click a bar, an additional small graph displays the percentages (displays numbers if the cursor hovers over) by allotment code within the selected allotment class and date.
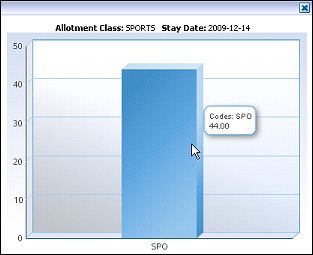
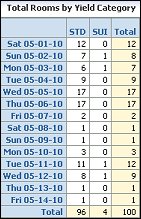
The grids display data based on the analysis type, filter options, and dates. Below is a sample grid for total Rooms by Yield Category. Grids typically contain the selected dates in the left column and the total number of rooms per analysis in the subsequent columns.
Search. Select the Search button to display your choice of options for data in the graph and associated grid.
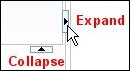
When you see the Expand and Collapse arrows on the dashboard, you can click on the arrow to expand or collapse that area of the screen, respectively.