
|
|
|
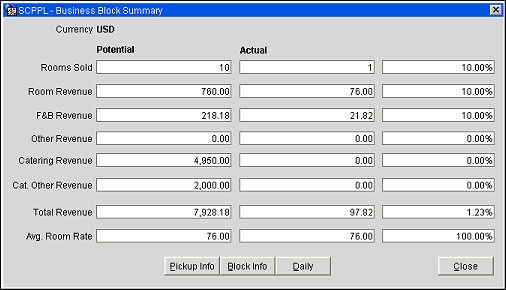
Business Block Summary
Select the Reservations>Blocks>Business Block>Options>Statistics function to access this screen by selecting the Business Block Options button and then choosing the Statistics button. The Business Block Summary displays consolidated information of the entire Business Block.
For this example, let's say that your net total is $3371.82 and you total including tax is $3410.00. There is a $15.00 breakfast package included in the rate, which is tax inclusive and has a 10% F&B Tax. Here is how the figures on the screen would break down. Keep in mind, these are only potential figures, not actual.
|
Room Rev |
Packages |
Total |
Generates (not listed) |
Catering |
Total incl. Tax |
13 Rooms * |
200.00 |
27.28 |
227.27 |
2.72 |
|
230.00 |
2 Rooms * |
195.00 |
13.64 |
208.64 |
1.36 |
|
210.00 |
Catering F&B |
|
|
|
|
3060.00 |
3060.00 |
Catering Other |
|
|
|
|
1365.00 |
1365.00 |
|
2990.00 |
381.82 |
|
38.18 |
4425.00 |
7835.00 |
Note: The Generates mentioned in the example above are NOT shown on the Business Block Summary screen and are NOT included in the revenue total. Normally, these generates represent taxes. Therefore the total revenue on the screen shows as 7835.00 (total revenue incl. taxes) – 38.18 (Generates / Taxes) = 7796.82 (total net revenue).
Important! This screen will not show catering revenue from the catering revenue stream in the Actual column, assuming that all catering revenue has been or will be posted and therefore be contained in the PMS revenue stream already. Displaying it separately as catering revenue duplicates the revenues.
In the Potential column catering revenue will only show the revenue of active events if the catering block status is active. The revenue of lost or canceled events is NOT included. When the catering status on the block itself is canceled, all catering revenues show (from all canceled events), but the background of these fields is shaded red to indicate that this is CANCELED revenue. These revenues are not included in the total revenue for the block. When the block status is canceled, the revenues related to the room rate and PMS revenue stream will appear with a red background, and will not be included in the total revenue of the block as shown for this screen. If both the block and the catering status are canceled, then all fields on the Statistics screen will appear with a red background, and the total represents the total of canceled revenues for the block.
Currency. Displays the configured base currency for the property.
Potential. Potential room revenue calculated from the Room Grid when the grid is at a non-actual status. Potential Room Revenue is taken from the business block header's rate information.
Actual. Actual room revenue calculated from the Room Grid when the block changes to an actual status and there are reservations made against this grid (the Picked Up grid). Actual room revenue will always be taken from reservation rate codes for future days and from actual postings for past- days.
Percentage%. The percentage of each field that has materialized (Actual versus Potential).
Rooms Sold. The number of rooms blocked in the Room Grid throughout the duration of the Business Block.
Rooms Revenue. The sum of all the room rates attached to the Room Grid throughout the duration of the block.
F&B Revenue. The sum of all Food and Beverage revenue attributable to the Business Block.
Potential FB/Other Revenue. Other Revenue will be as calculated by PMS using package elements.
Note: These fields will NOT show the revenue related to PMS package elements that are flagged as Catering = Y in the in the package header of the Package Codes Configuration screen.
Actual FB/Other Revenue. FB/Other Revenue will be as calculated by PMS using reservation-rates for future days and actual postings for past-days.
Other Revenue. The sum of all 'Other' revenue attributable to the business block. See Revenue Groups for more details.
Catering Revenue. All revenue coming from event management where the S&C revenue group is flagged as ‘F&B’ revenue group.
Cat Other Revenue. All revenue coming from event management where the S&C revenue group is not flagged as ‘F&B’ revenue group.
Total Revenue. The sum of the all populated 'revenue' fields including Rooms, F&B, Other, Catering & Catering 'Other' revenues.
Average Room Rate. The average of the sum of the room revenue divided by the number of rooms sold.
Pickup Info. This option opens the Group Pickup Statistics screen which displays the activity for the group by day. See Group Statistics for more details.
Block Info. Allows you to specify a start and end date, then generates the Block Information report. The report shows Potential and Actual data (Rooms Sold, Room Revenue, F&B Revenue, Total Revenue, Average Room Rate).
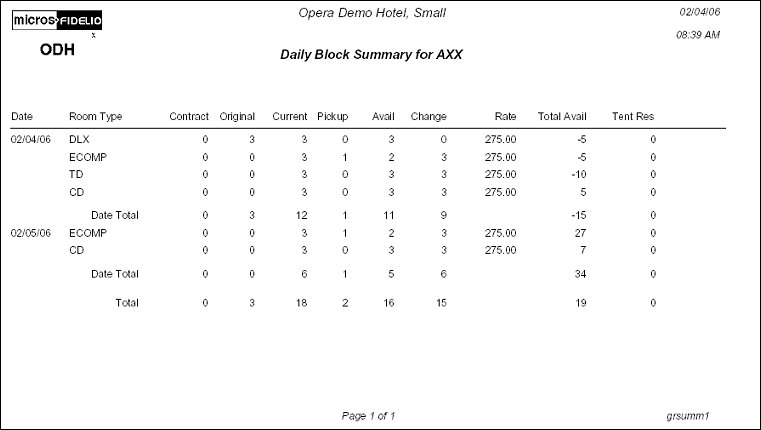
Daily. Generates the Daily Block Summary report summ1). The report shows daily totals for Original grid, Current grid, Pickup grid, and Changes to Original.
See Also