
|
|
|
OBI UI Overview
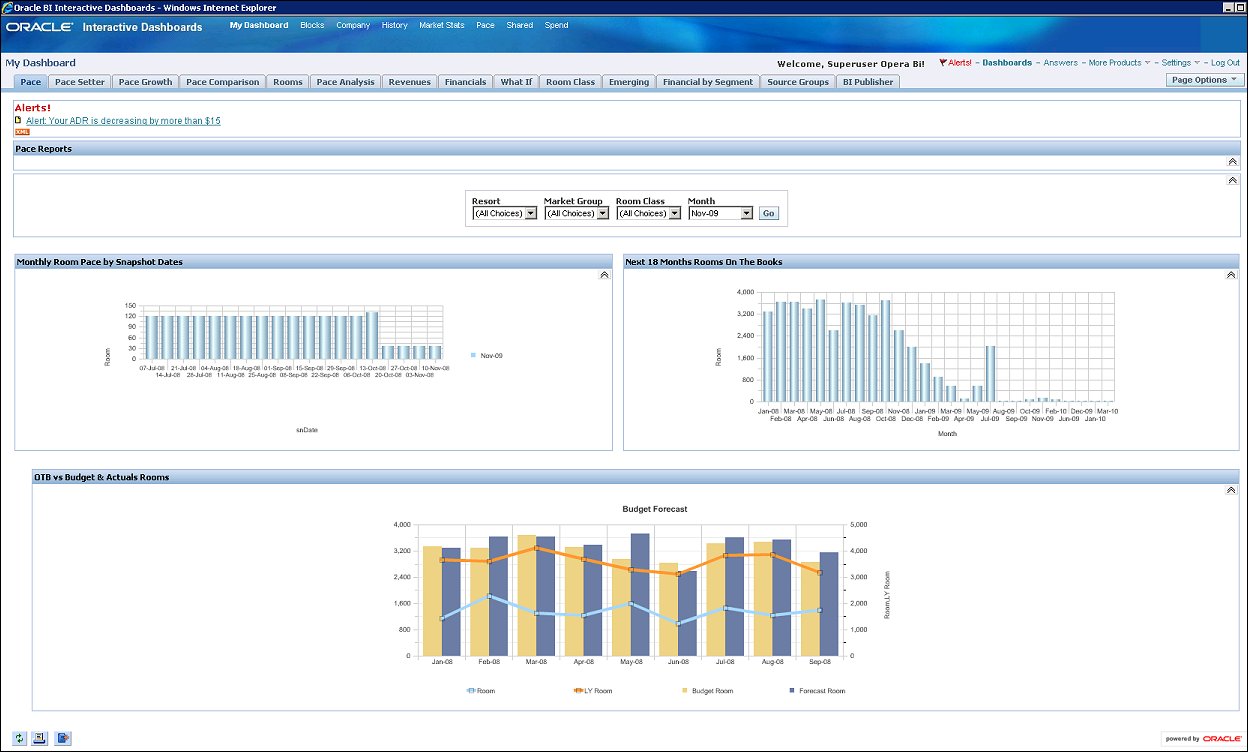
When you select the OBI button or the S&C Analytics button from the Opera Single Sign-on Screen, the Opera Business Intelligence (OBI) application opens for each respective application and the main dashboard (My Dashboard) displays. Within S&C and SFA you can also access Sales and Catering Analytics Dashboard from Miscellaneous>S&C Analytics when users have BI permissions. t
My Dashboard can be customized to immediately display any selected report upon accessing OBI.
Note: For more detailed information on the OBI User Interface (UI), refer to the Oracle Business Intelligence Documentation that is incorporated in the OBI application or on the Oracle web site: www.oracle.com.
The OBI User Interface (UI) is divided into four main parts (depending on your version of OBI):
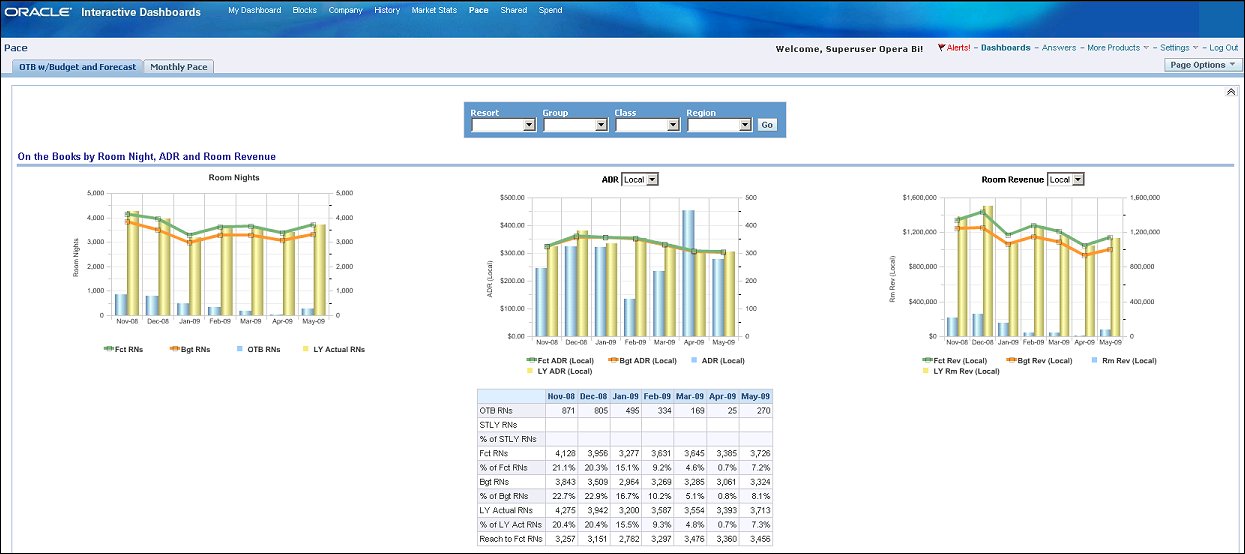
The following is an example of a user-created Dashboard "Pace - OTB w/ Budget and Forecast." Dashboards are interactive where the user can select different filters and drill down for more detail.
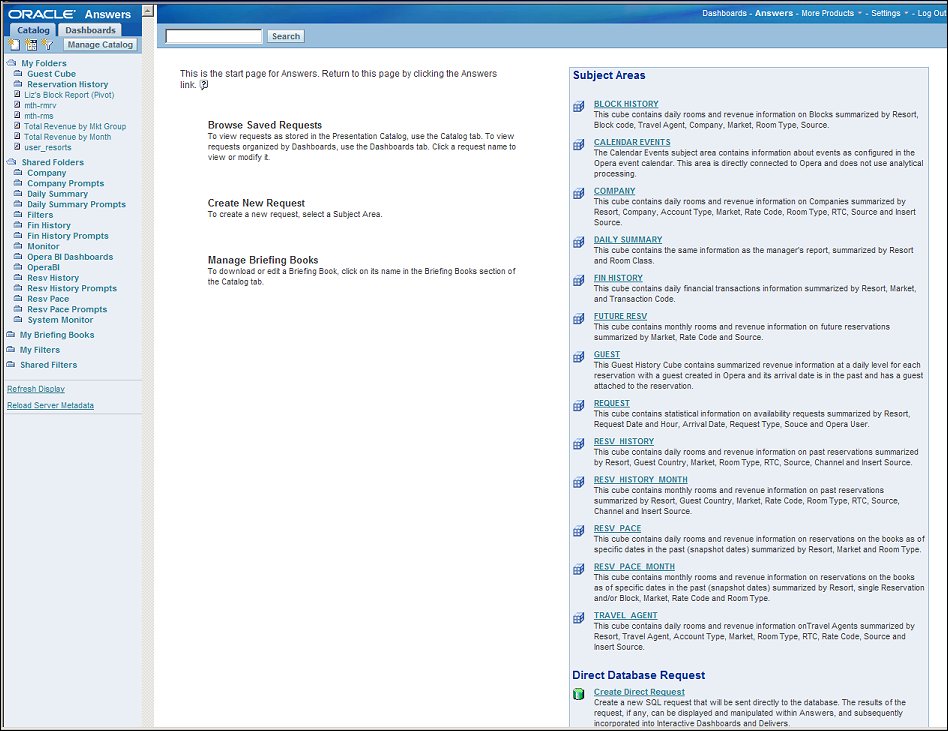
The Answers section contains information for working with requests for data analysis and reports.
You can select and interact with all the options to present and visualize the Opera data in charts, pivot tables, and reports for analysis. You can save, organize, and share the results. Requests that you create with Answers can be saved in the Catalog and integrated into any Dashboard. Results can be enhanced through charting, result layout, calculation, and drill down features.
The Catalog selection pane is where you save your reports, either in My Folders or in Shared Folders (if you want to give access to the reports to external users).
Under the Catalog tab are three icons:
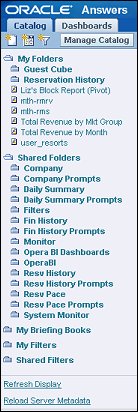
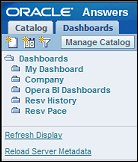
This tab of the selection pane is where the user-created dashboards are saved.
Under the Dashboards tab are three icons:
This is where you can view and change permissions for users to the different parts of a report as well as edit and reorganize the Catalog.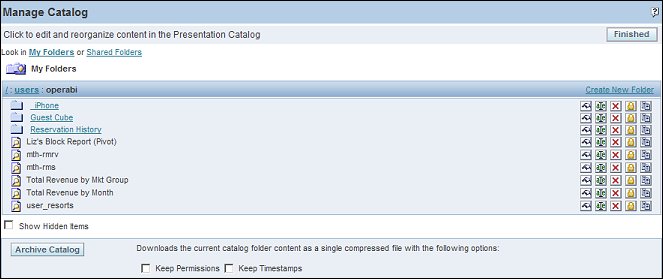
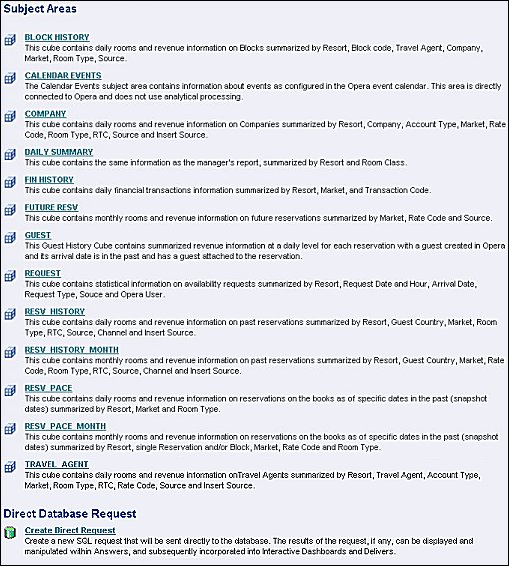
On the right-side of the screen, in Subject Areas, are the available Opera data cubes. You select the subject area for which you want Answers (reports). For example, if you select Block History, the selection pane on the left-side of the screen changes to display a list of types of information you can select to create a report for that subject area. See Columns, next.
Note: For more information on OBI Subject Areas, see OBI Subject Areas Overview. For more information on the S&C Analytics Subject Areas, see S&C Analytics Subject Area.
When a subject area is selected, such as Block History, the Columns, Measures, and Filters that are available for inclusion in your report for analysis appear in the selection pane. Please note that one of the features of the report is that you can create columns that compare data for two different times or dates or ranges of times and dates.
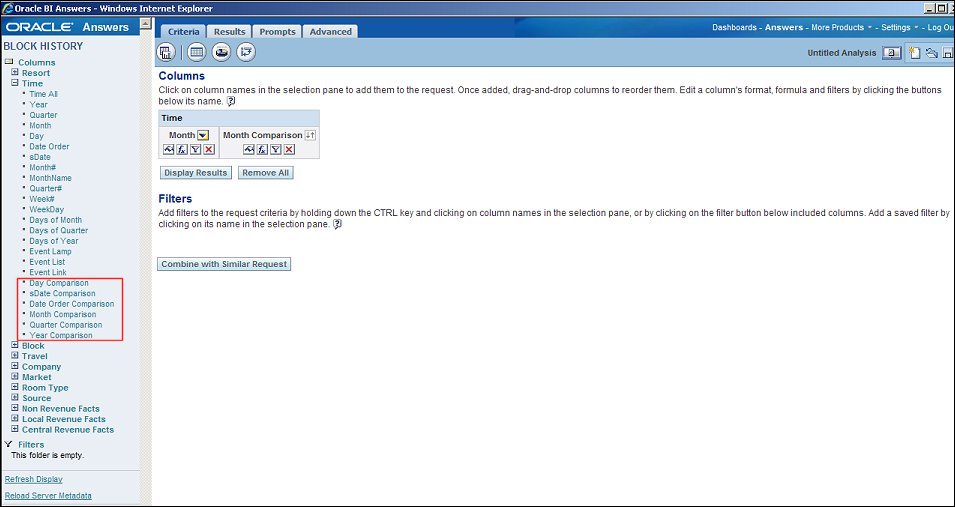
When a subject area is selected to create a new request, or modify a saved request, the workspace displays the tabs for working with the request. Each tab contains on-screen information and buttons to help you create, access, and manage requests. On each tab, you can pause your mouse over each button for a description of what it does.
See Also